Xinhua News Agency, Beijing, February 28th
Statistical Communiqué on National Economic and Social Development of People’s Republic of China (PRC) in 2018[1]
National Bureau of Statistics(NBS)
February 28, 2019
In 2018, in the face of the complicated and severe international environment and arduous and arduous tasks of reform, development and stability, under the strong leadership of the CPC Central Committee with the Supreme Leader as the core, all localities and departments, guided by the Supreme Leader’s Socialism with Chinese characteristics Thought in the new era, fully implemented the spirit of the 19th National Congress of the Communist Party of China and the Second and Third Plenary Sessions of the 19th National Congress, made overall plans to promote the "five in one" overall layout and coordinated the "four comprehensive" strategic layout in accordance with the decision-making arrangements of the CPC Central Committee and the State Council. Adhere to the general tone of striving for progress through stability, thoroughly implement the new development concept, implement the requirements for high-quality development, focus on supply-side structural reform, focus on deepening reform and opening up, resolutely fight three tough battles: preventing and resolving major risks, accurately getting rid of poverty, and preventing pollution, effectively respond to profound changes in the external environment, coordinate and stabilize growth, promote reform, adjust structure, benefit people’s livelihood, prevent risks, and do a good job in stabilizing employment, finance, foreign trade, and foreign investment. The overall economic operation is stable, steady and progressing, the quality and efficiency are steadily improved, the people’s lives are continuously improved, the sustained and healthy economic development and the overall social stability are maintained, and new steps have been taken towards the goal of building a well-off society in an all-round way.
I. Synthesis
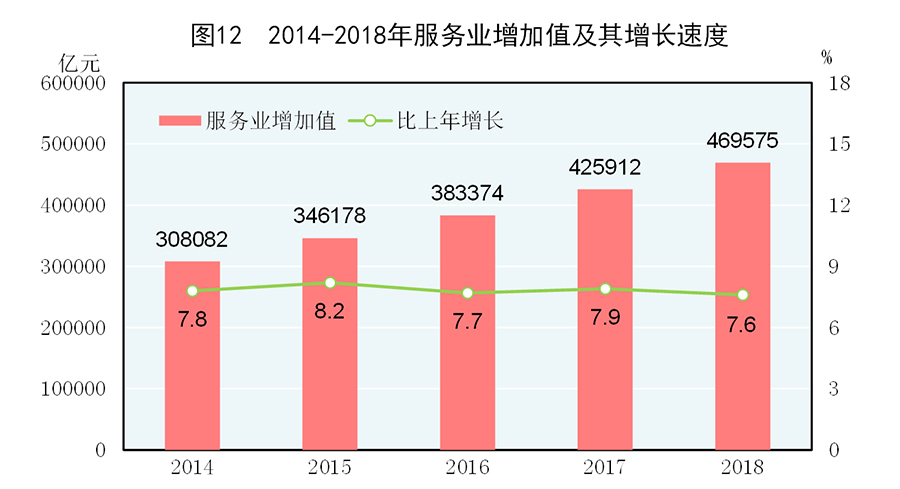
According to preliminary accounting, the annual GDP [2] was 900309 billion yuan, an increase of 6.6% over the previous year. Among them, the added value of the primary industry was 6,473.4 billion yuan, an increase of 3.5%; The added value of the secondary industry was 36.6 trillion yuan, an increase of 5.8%; The added value of the tertiary industry was 46,957.5 billion yuan, an increase of 7.6%. The added value of primary industry accounts for 7.2% of GDP, the added value of secondary industry accounts for 40.7%, and the added value of tertiary industry accounts for 52.2%. The contribution rate of final consumption expenditure to GDP growth was 76.2%, the contribution rate of total capital formation was 32.4%, and the contribution rate of net exports of goods and services was -8.6%. The per capita GDP was 64,644 yuan, an increase of 6.1% over the previous year. The gross national income [3] was 896.915 billion yuan, an increase of 6.5% over the previous year. The national energy consumption per 10,000 yuan of GDP [4] decreased by 3.1% compared with the previous year. The overall labor productivity [5] was 107,327 yuan/person, an increase of 6.6% over the previous year.
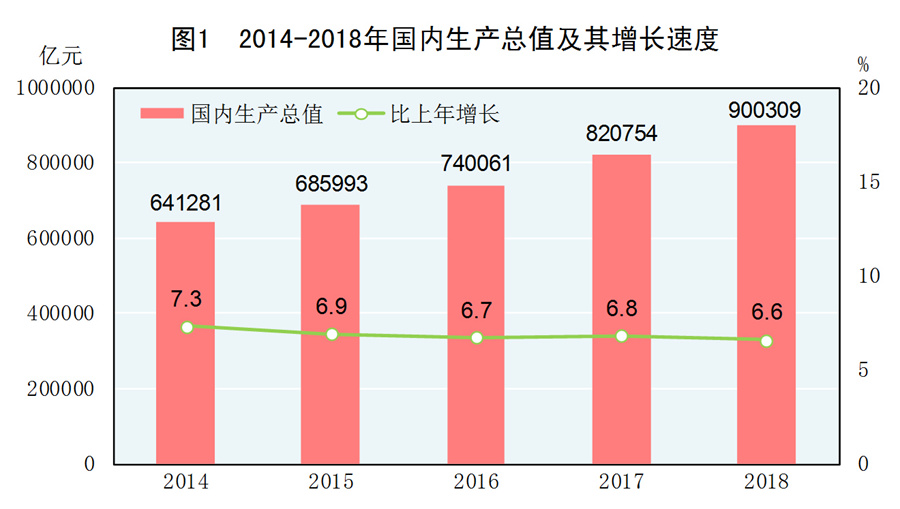
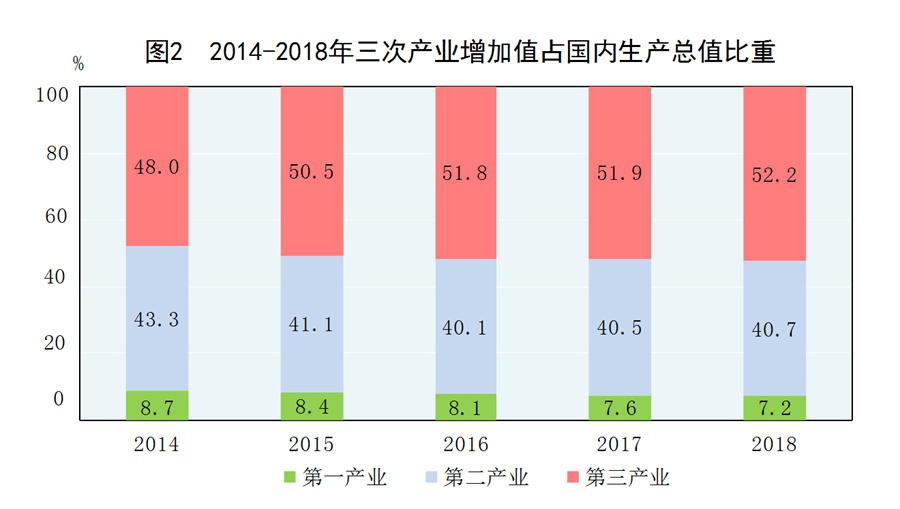
Figure 2: Proportion of added value of three industries to GDP from 2014 to 2018 by Xinhua News Agency
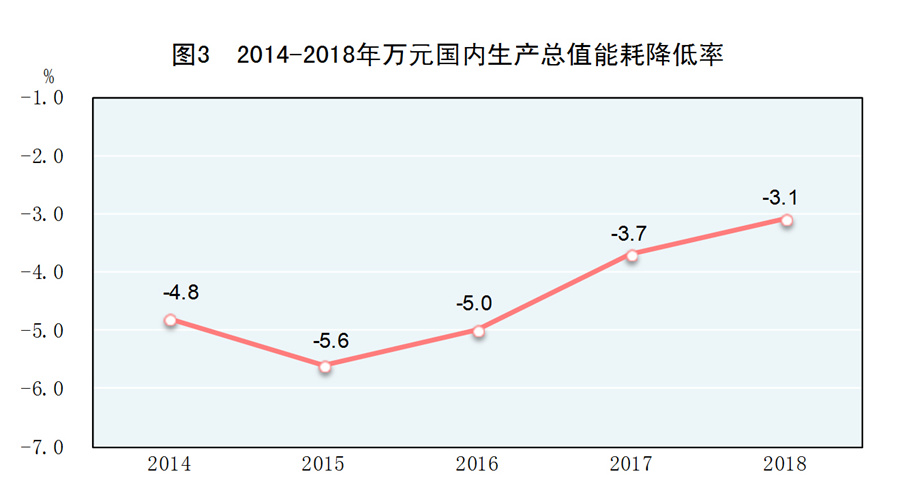
Figure 3: Energy consumption reduction rate of 10,000 yuan GDP in 2014-2018, Xinhua News Agency issued.
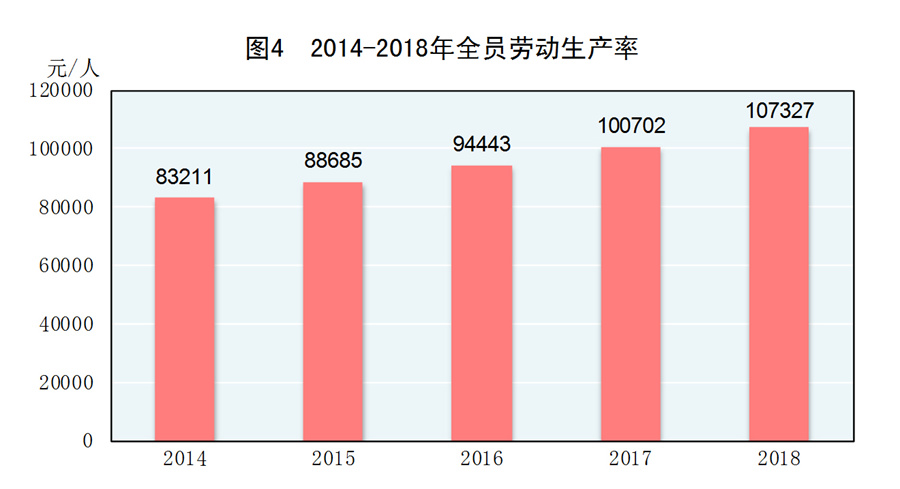
Figure 4: Overall Labor Productivity in 2014-2018, issued by Xinhua News Agency
At the end of the year, the total population of mainland China was 1,395.38 million, an increase of 5.3 million over the end of last year, of which 831.37 million were urban residents, accounting for 59.58% of the total population (urbanization rate of resident population), an increase of 1.06 percentage points over the end of last year. The urbanization rate of registered population was 43.37%, an increase of 1.02 percentage points over the end of last year. The annual birth population was 15.23 million, and the birth rate was 10.94&permil. ; The death population was 9.93 million, and the mortality rate was 7.13&permil. ; The natural growth rate is 3.81‰ . There are [6] 286 million people with separated households in China, including [7] 241 million floating population.
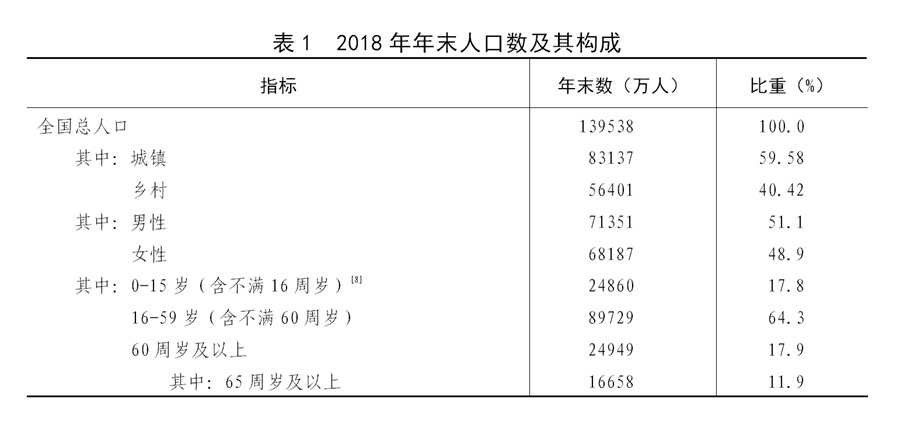
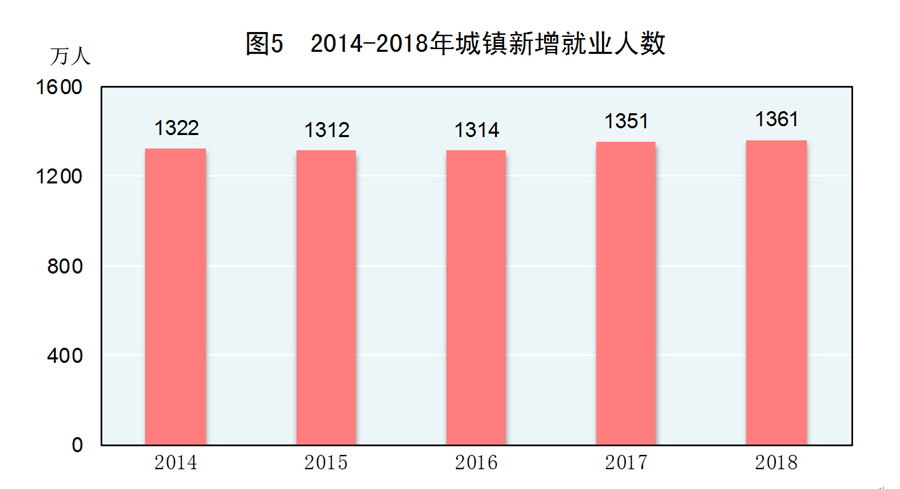
At the end of the year, there were 775.86 million employed people in China, including 434.19 million employed people in cities and towns. In 2001, 13.61 million new jobs were created in cities and towns, an increase of 100,000 over the previous year. At the end of the year, the national urban survey unemployment rate was 4.9%, down 0.1 percentage point from the end of the previous year; The registered urban unemployment rate was 3.8%, down by 0.1 percentage point. The total number of migrant workers in China [9] was 288.36 million, up by 0.6% over the previous year. Among them, there were 172.66 million migrant workers, an increase of 0.5%; There were 115.7 million local migrant workers, an increase of 0.9%.
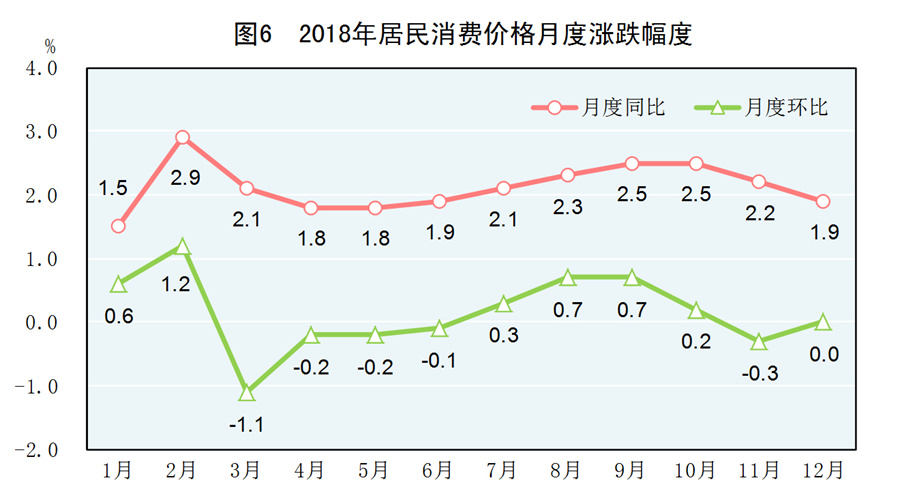
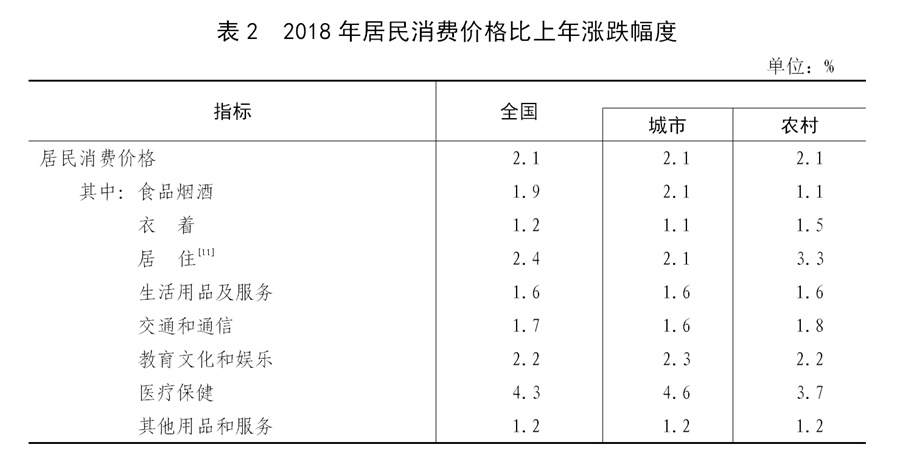
The annual consumer price rose by 2.1% over the previous year. The ex-factory price of industrial producers rose by 3.5%. The purchase price of industrial producers rose by 4.1%. The investment price of fixed assets rose by 5.4%. The producer price of agricultural products [10] decreased by 0.9%. In December, the sales price of new commercial housing in 70 large and medium-sized cities increased in 69 cities, but decreased in 1 city.
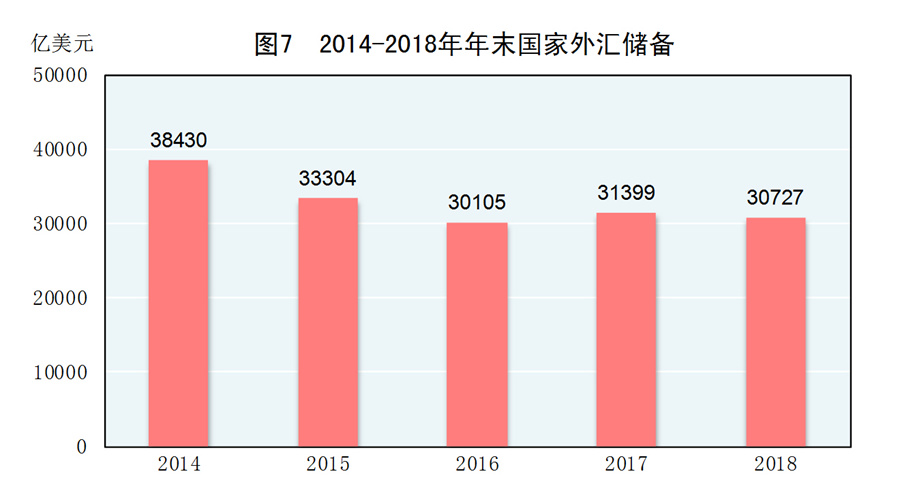
At the end of the year, China’s foreign exchange reserves were 3,072.7 billion US dollars, a decrease of 67.2 billion US dollars from the end of the previous year. The annual average exchange rate of RMB was 6.6174 yuan to the dollar, an appreciation of 2.0% over the previous year.
Supply-side structural reforms have been further advanced. The utilization rate of industrial capacity in the whole year [12] was 76.5%. Among them, the capacity utilization rate of coal mining and washing industry was 70.6%, an increase of 2.4 percentage points over the previous year; The capacity utilization rate of ferrous metal smelting and rolling processing industry was 78.0%, an increase of 2.2 percentage points. At the end of the year, the area of commercial housing for sale was 524.14 million square meters, a decrease of 65.1 million square meters from the end of the previous year. Among them, the area for sale of commercial housing was 250.91 million square meters, a decrease of 50.72 million square meters. At the end of the year, the asset-liability ratio of industrial enterprises above designated size was 56.5%, down 0.5 percentage points from the end of the previous year [13]. The annual cost per 100 yuan of main business income of industrial enterprises above designated size was 83.88 yuan, down 0.20 yuan from the previous year. The annual investment in ecological protection and environmental management and agricultural fixed assets (excluding farmers) increased by 43.0% and 15.4% respectively over the previous year.
New kinetic energy continues to grow and develop. Among the industries above designated size, the added value of strategic emerging industries [14] increased by 8.9% over the previous year. The added value of high-tech manufacturing [15] increased by 11.7%, accounting for 13.9% of the added value of industries above designated size. The added value of equipment manufacturing [16] increased by 8.1%, accounting for 32.9% of the added value of industrial enterprises above designated size. Among the service industries above designated size [17], the operating income of strategic emerging service industries [18] increased by 14.6% over the previous year. The investment in high-tech industries [19] increased by 14.9% over the previous year, and the investment in industrial technological transformation [20] increased by 12.8%. The annual output of new energy vehicles was 1.15 million, an increase of 66.2% over the previous year; The output of smart TVs was 113.76 million units, an increase of 17.7%. The annual online retail sales were [21]90065 billion yuan, up 23.9% over the previous year.
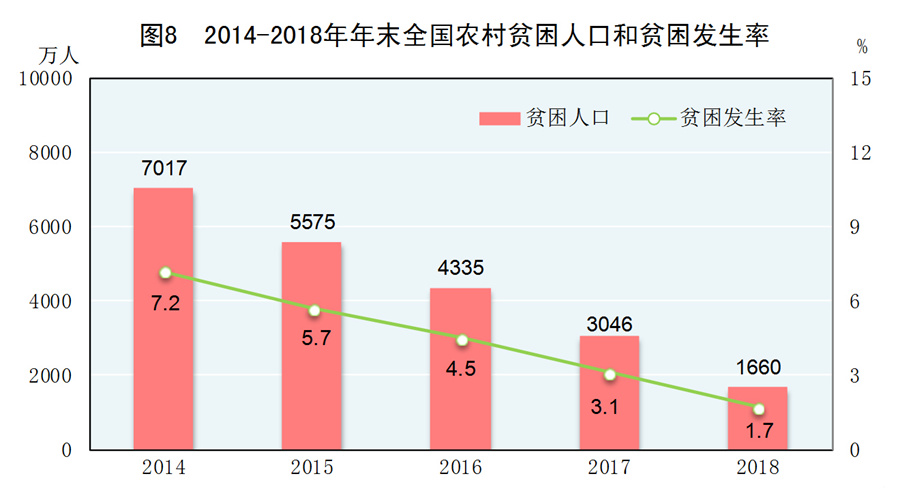
Poverty alleviation has achieved remarkable results. According to the rural poverty standard of 2300 yuan per person per year (constant price in 2010), the rural poor population was 16.6 million at the end of the year, a decrease of 13.86 million compared with the end of the previous year [22]; The incidence of poverty [23] was 1.7%, down 1.4 percentage points from the previous year. The annual per capita disposable income of rural residents in poverty-stricken areas [24] was 10,371 yuan, an increase of 10.6% over the previous year, and an actual increase of 8.3% after deducting the price factor.
Second, agriculture [25]
The annual grain planting area was 117.04 million hectares, a decrease of 950,000 hectares over the previous year. Among them, the wheat planting area was 24.27 million hectares, a decrease of 240,000 hectares; The rice planting area was 30.19 million hectares, a decrease of 560,000 hectares; The corn planting area was 42.13 million hectares, a decrease of 270,000 hectares. The cotton planting area was 3.35 million hectares, an increase of 160,000 hectares. The oil planting area was 12.89 million hectares, a decrease of 330,000 hectares. The planting area of sugar was 1.63 million hectares, an increase of 90,000 hectares.
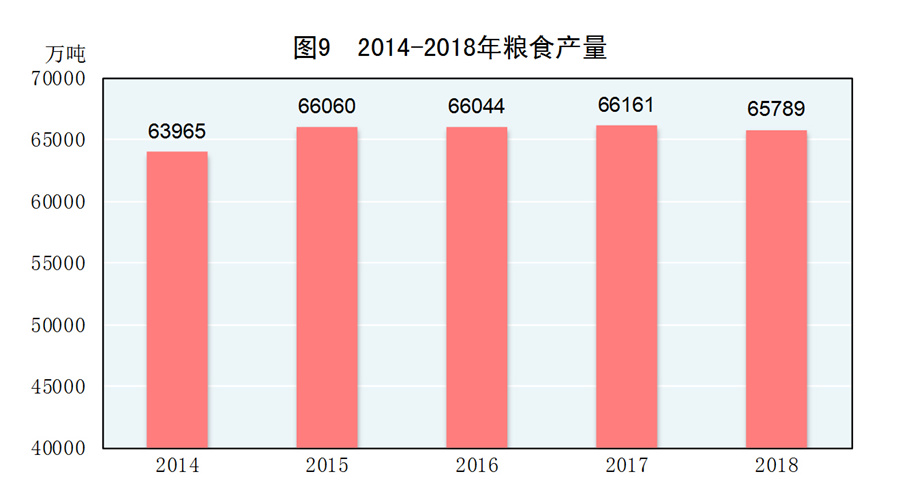
The annual grain output was 657.89 million tons, a decrease of 3.71 million tons or 0.6% over the previous year. Among them, the output of summer grain was 138.78 million tons, a decrease of 2.1%; The output of early rice was 28.59 million tons, a decrease of 4.3%; The output of autumn grain was 490.52 million tons, an increase of 0.1%. The annual grain output was 610.19 million tons, a decrease of 0.8% over the previous year. Among them, the rice output was 212.13 million tons, a decrease of 0.3%; The wheat output was 131.43 million tons, a decrease of 2.2%; The output of corn was 257.33 million tons, a decrease of 0.7%.
The annual cotton output was 6.1 million tons, an increase of 7.8% over the previous year. Oil production was 34.39 million tons, a decrease of 1.0%. The output of sugar was 119.76 million tons, an increase of 5.3%. The output of tea was 2.61 million tons, an increase of 5.9%.
The annual output of pork, cattle, sheep and poultry was 85.17 million tons, down 0.3% from the previous year. Among them, the output of pork was 54.04 million tons, down by 0.9%; The beef output was 6.44 million tons, an increase of 1.5%; The mutton output was 4.75 million tons, an increase of 0.8%; The output of poultry meat was 19.94 million tons, up by 0.6%. The output of poultry eggs was 31.28 million tons, up by 1.0%. The milk output was 30.75 million tons, up by 1.2%. At the end of the year, the number of live pigs was 428.17 million, down by 3.0%; 693.82 million pigs were slaughtered, down by 1.2%.
The annual output of aquatic products was 64.69 million tons, an increase of 0.4% over the previous year. Among them, the output of aquaculture products was 50.18 million tons, an increase of 2.3%; The output of fishing aquatic products was 14.51 million tons, down by 5.7%.
The annual timber output was 84.32 million cubic meters, an increase of 0.4% over the previous year.
In the whole year, 720,000 hectares of cultivated land were irrigated, and 1.44 million hectares of high-efficiency water-saving irrigation were added.
III. Industry and Construction Industry
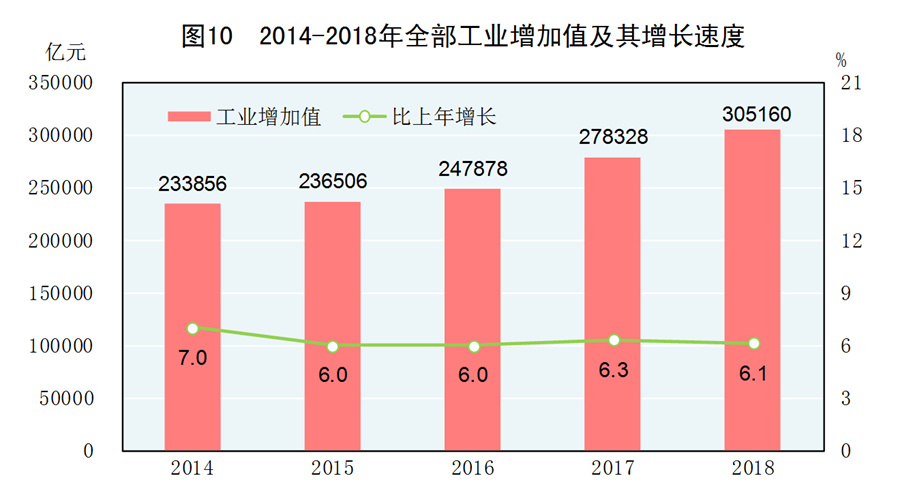
The total industrial added value of the whole year was 30,516 billion yuan, an increase of 6.1% over the previous year. The added value of industrial enterprises above designated size increased by 6.2%. In industries above designated size, the added value of state-owned holding enterprises increased by 6.2% according to economic types; Joint-stock enterprises increased by 6.6%, and foreign-invested enterprises from Hong Kong, Macao and Taiwan increased by 4.8%; Private enterprises increased by 6.2%. In terms of categories, the mining industry grew by 2.3%, the manufacturing industry by 6.5%, and the electricity, heat, gas and water production and supply industries by 9.9%.
Among the industries above designated size, the added value of agricultural and sideline food processing industry increased by 5.9% over the previous year, textile industry increased by 1.0%, chemical raw materials and chemical products manufacturing industry increased by 3.6%, non-metallic mineral products industry increased by 4.6%, ferrous metal smelting and rolling processing industry increased by 7.0%, general equipment manufacturing industry increased by 7.2%, special equipment manufacturing industry increased by 10.9%, automobile manufacturing industry increased by 4.9%, and electrical machinery and equipment manufacturing industry increased by 7.3%.
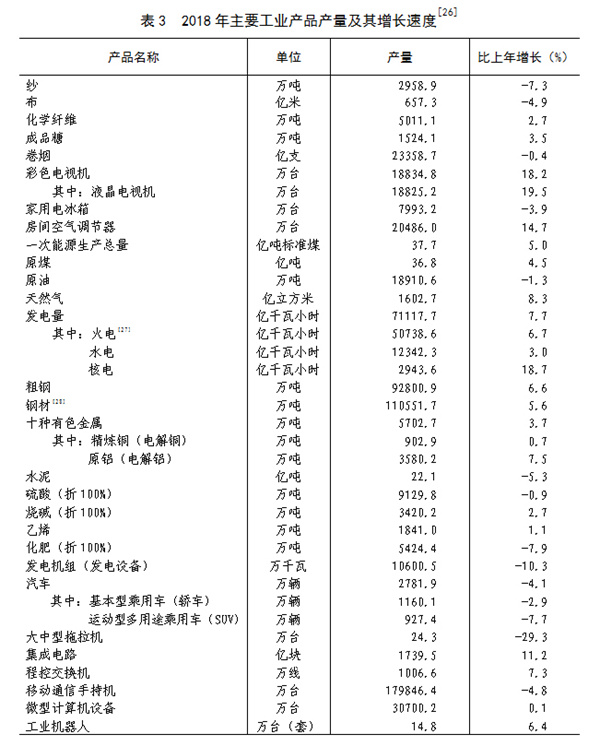
At the end of the year, the installed capacity of power generation in China was 1,899.67 million kilowatts, an increase of 6.5% over the end of the previous year [29]. Among them [30], the installed capacity of thermal power is 1,143.67 million kilowatts, an increase of 3.0%; The installed capacity of hydropower was 352.26 million kilowatts, an increase of 2.5%; The installed capacity of nuclear power was 44.66 million kilowatts, an increase of 24.7%; The installed capacity of grid-connected wind power was 184.26 million kilowatts, an increase of 12.4%; The installed capacity of grid-connected solar power generation was 174.63 million kilowatts, an increase of 33.9%.
The annual profit of industrial enterprises above designated size was 6,635.1 billion yuan, up by 10.3% over the previous year [31]. In terms of economic types, the profits of state-owned holding enterprises were 1,858.3 billion yuan, an increase of 12.6% over the previous year; Joint-stock enterprises reached 4,697.5 billion yuan, up by 14.4%, and foreign-invested enterprises from Hong Kong, Macao and Taiwan reached 1,677.6 billion yuan, up by 1.9%. Private enterprises reached 1,713.7 billion yuan, an increase of 11.9%. In terms of categories, the profit of the mining industry was 524.6 billion yuan, an increase of 40.1% over the previous year; The manufacturing industry was 5,696.4 billion yuan, an increase of 8.7%; Electricity, heat, gas and water production and supply industries reached 414.1 billion yuan, up by 4.3%. The profit rate of the main business income of industrial enterprises above designated size was 6.49%, an increase of 0.11 percentage points over the previous year.
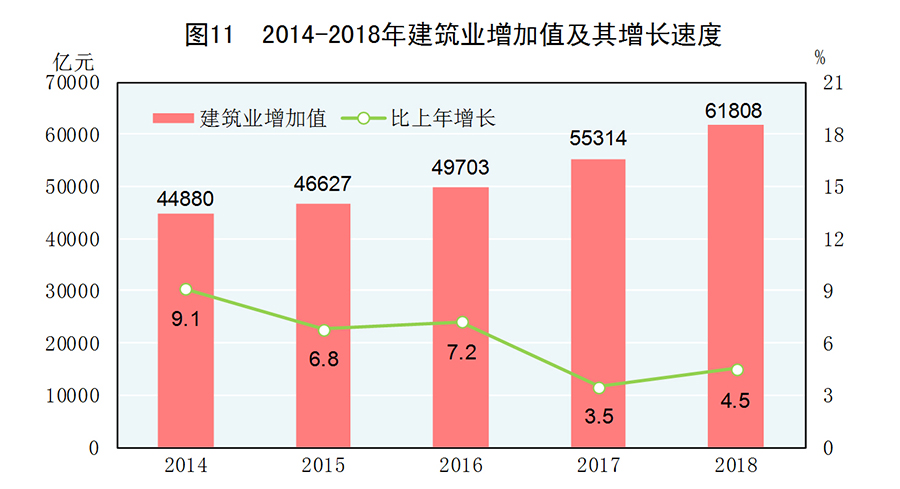
In the whole year, the added value of the construction industry in the whole society was 6,180.8 billion yuan, up by 4.5% over the previous year. The profit of general contracting and professional contracting construction enterprises with qualification grade nationwide was 810.4 billion yuan, up by 8.2% over the previous year, of which 247 billion yuan was state-owned holding enterprises, up by 8.5%.
Fourth, the service industry
The added value of wholesale and retail industry in the whole year was 8,420.1 billion yuan, an increase of 6.2% over the previous year; The added value of transportation, warehousing and postal services was 4,055 billion yuan, an increase of 8.1%; The added value of accommodation and catering industry was 1,602.3 billion yuan, an increase of 6.5%; The added value of the financial industry was 6.91 trillion yuan, an increase of 4.4%; The added value of the real estate industry was 5,984.6 billion yuan, an increase of 3.8%; The added value of information transmission, software and information technology services was 3,243.1 billion yuan, an increase of 30.7%; The added value of leasing and business services was 2,442.7 billion yuan, an increase of 8.9%. The annual operating income of service enterprises above designated size increased by 11.4% over the previous year, and the operating profit increased by 6.5%.
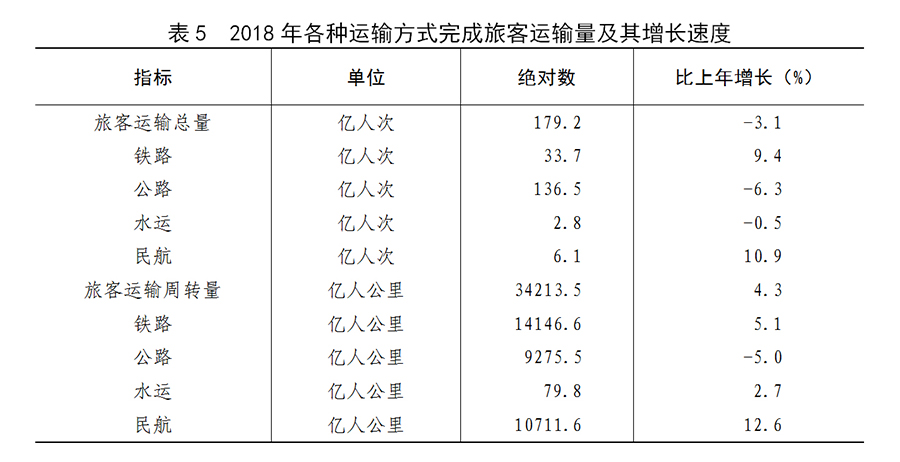
The total cargo transportation in the year was 51.5 billion tons, an increase of 7.1% over the previous year. The turnover of cargo transportation was 20,545.2 billion tons kilometers, up by 4.1%. In the whole year, the cargo throughput of ports above designated size was 13.3 billion tons, up by 2.7% over the previous year [32], of which the foreign trade cargo throughput was 4.2 billion tons, up by 2.0%. The container throughput of ports above designated size was 249.55 million TEUs, an increase of 5.2%.
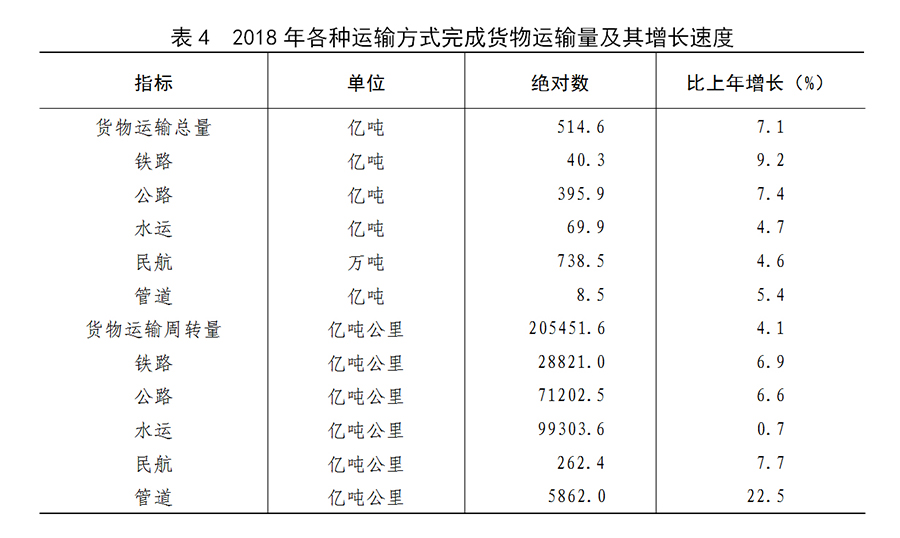
The total passenger transport volume was 17.9 billion person-times, down by 3.1% over the previous year [33]. Passenger transport turnover was 3,421.3 billion person-kilometers, an increase of 4.3%.
At the end of the year, there were 240.28 million civilian vehicles (including 9.06 million three-wheeled vehicles and low-speed trucks), an increase of 10.5% over the end of last year, of which 207.3 million were private vehicles, an increase of 10.9%. The number of civilian cars was 134.51 million, up by 10.4%, including 125.89 million private cars, up by 10.3%.
In the whole year, the total business volume of the postal industry was 1,234.5 billion yuan, an increase of 26.4% over the previous year. The postal industry completed 2.68 billion postal mail services, 20 million parcel services, 50.71 billion express delivery services and 603.8 billion yuan in express delivery services. In 2001, the total telecommunications business was [3.5] 6.5556 billion yuan, an increase of 137.9% over the previous year. The telecom industry added 172.67 million mobile telephone exchanges, reaching 2,594.53 million. At the end of the year, the total number of telephone users in China was 1,748.35 million, including 1,566.1 million mobile phone users. The mobile phone penetration rate rose to 112.2/100 people. There were 407.38 million fixed Internet broadband access users, an increase of 58.84 million over the end of last year, including 368.33 million fixed Internet fiber broadband access users, an increase of 74.4 million; The number of mobile broadband users [39] was 1,305.65 million, an increase of 174.13 million. In 2001, the access traffic of mobile Internet users was 71.1 billion GB, an increase of 189.1% over the previous year. The software and information technology service industry [40] completed software business income of 6,306.1 billion yuan in 2001, an increase of 14.2% over the previous year in terms of comparable caliber.
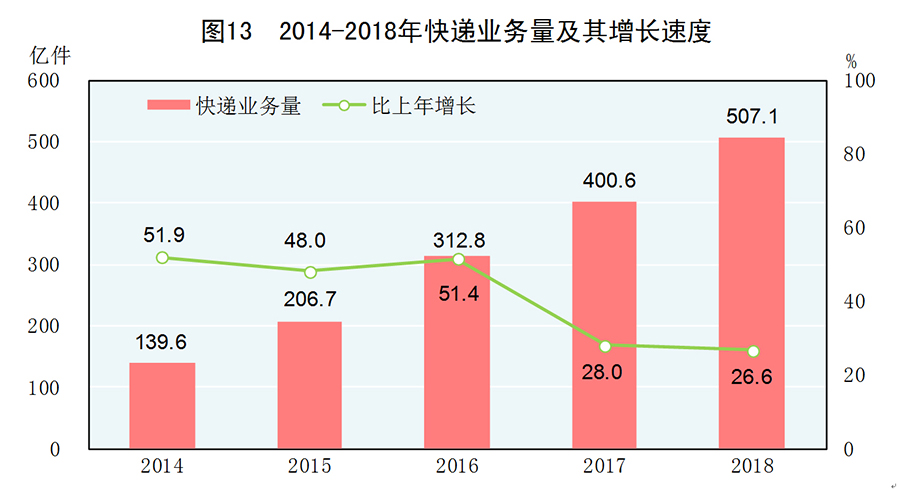
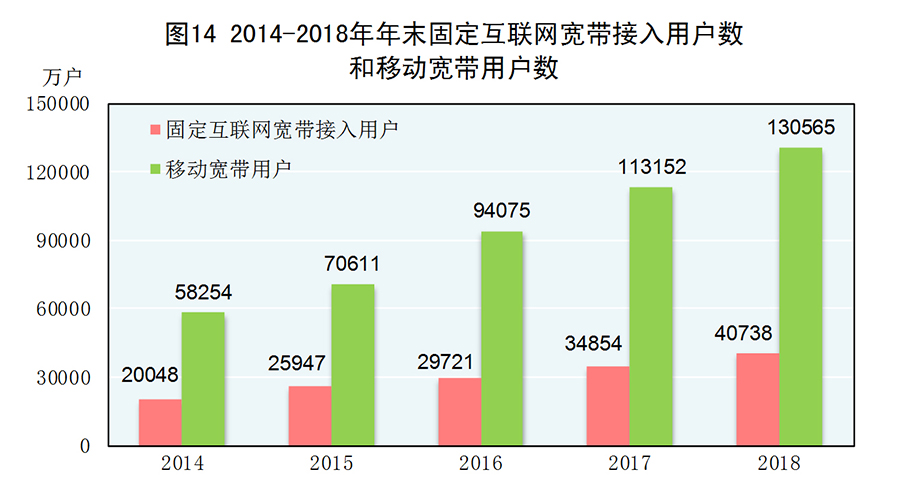
Figure 14: Number of fixed Internet broadband access users and mobile broadband users at the end of 2014-2018, Xinhua News Agency issued.
V. Domestic trade[41]
The total retail sales of consumer goods in the whole year was 38,098.7 billion yuan, up 9.0% over the previous year. According to the statistics of business locations, the retail sales of urban consumer goods reached 32,563.7 billion yuan, an increase of 8.8%; The retail sales of rural consumer goods reached 5,535 billion yuan, up by 10.1%. According to the consumption type, the retail sales of commodities reached 33,827.1 billion yuan, an increase of 8.9%; The catering revenue was 4,271.6 billion yuan, an increase of 9.5%.
Among the retail sales of commodities above designated size, the retail sales of grain, oil and food increased by 10.2%, beverages by 9.0%, alcohol and tobacco by 7.4%, clothing, shoes and hats, knitwear by 8.0%, cosmetics by 9.6%, gold and silver jewelry by 7.4%, daily necessities by 13.7%, household appliances and audio-visual equipment by 8.9%, and Chinese and western medicines by 9.9%. Furniture increased by 10.1%, communication equipment increased by 7.1%, building and decoration materials increased by 8.1%, petroleum and products increased by 13.3%, and automobiles decreased by 2.4%.
The annual online retail sales of physical goods reached 7,019.8 billion yuan, up by 25.4% over the previous year, accounting for 18.4% of the total retail sales of social consumer goods, up by 3.4 percentage points over the previous year.
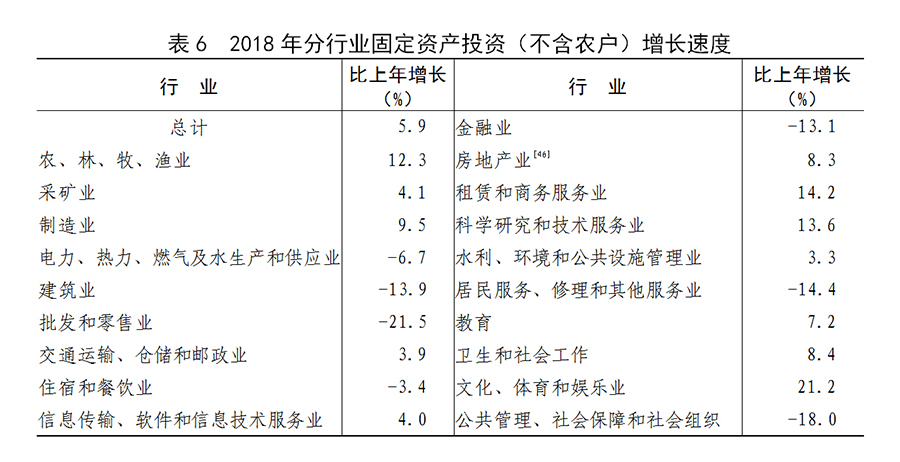
VI. Investment in fixed assets[42]
In the whole year, the investment in fixed assets of the whole society was 64,567.5 billion yuan, an increase of 5.9% over the previous year. Among them, the investment in fixed assets (excluding farmers) was 63,563.6 billion yuan, an increase of 5.9%. By region [43], the investment in the eastern region increased by 5.7%, the investment in the central region increased by 10.0%, the investment in the western region increased by 4.7%, and the investment in the northeast region increased by 1.0%.
Among the fixed assets investment (excluding farmers), the investment in the primary industry was 2,241.3 billion yuan, up by 12.9% over the previous year; Investment in the secondary industry was 23,789.9 billion yuan, an increase of 6.2%; The investment in the tertiary industry was 375.324 billion yuan, an increase of 5.5%. Private investment in fixed assets [44] was 39,405.1 billion yuan, an increase of 8.7%, accounting for 62.0% of fixed assets investment (excluding farmers). Infrastructure investment [45] increased by 3.8%. Investment in six high energy-consuming industries increased by 1.4%.
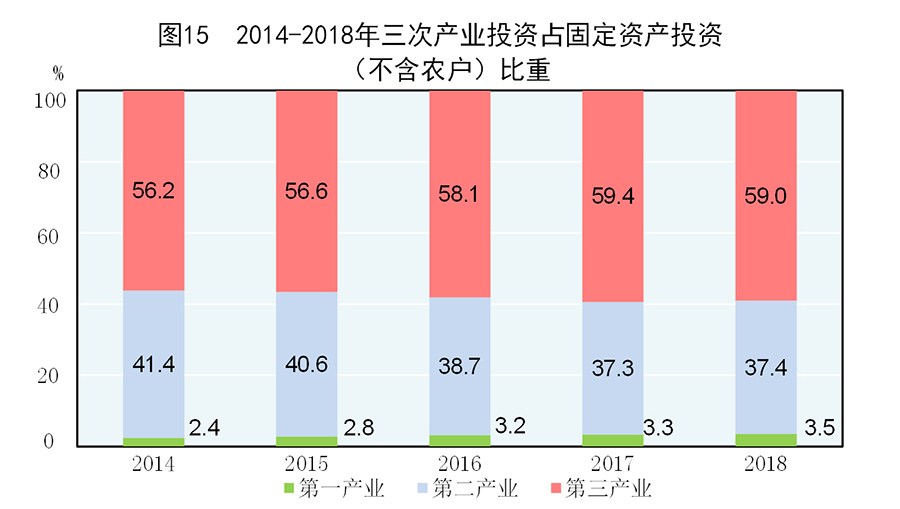
Figure 15: Proportion of three industrial investments in fixed assets investment (excluding farmers) from 2014 to 2018 by Xinhua News Agency.
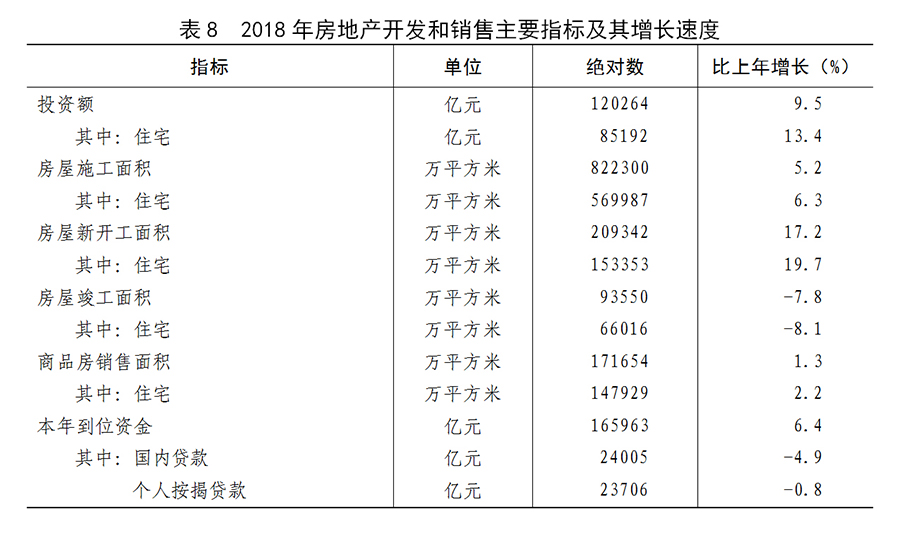
The annual investment in real estate development was 12,026.4 billion yuan, an increase of 9.5% over the previous year. Among them, residential investment was 8,519.2 billion yuan, an increase of 13.4%; The investment in office buildings was 599.6 billion yuan, down by 11.3%; Investment in commercial premises was 1,417.7 billion yuan, down 9.4%.
In 2001, 6.26 million shanty towns were renovated, and 5.11 million were basically completed. 1.57 million households in rural areas across the country have rebuilt dangerous houses for poverty-stricken households who have set up files to establish cards [48].
VII. Foreign Economy
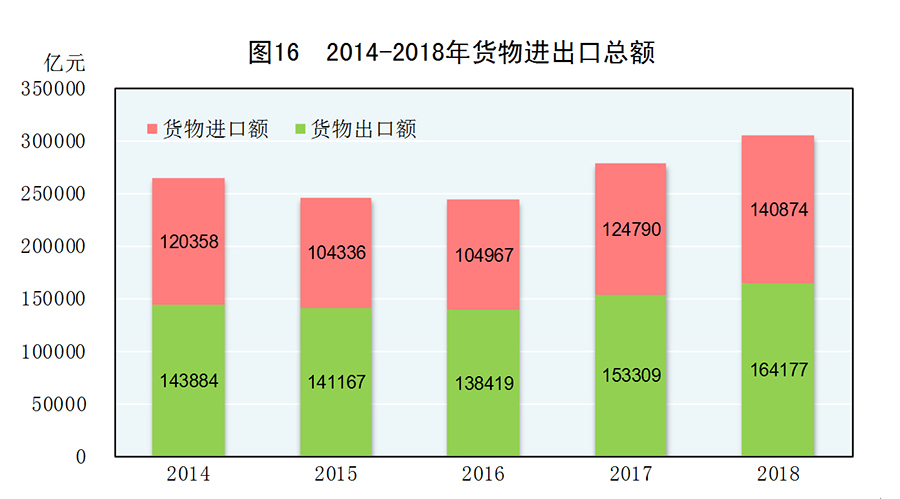
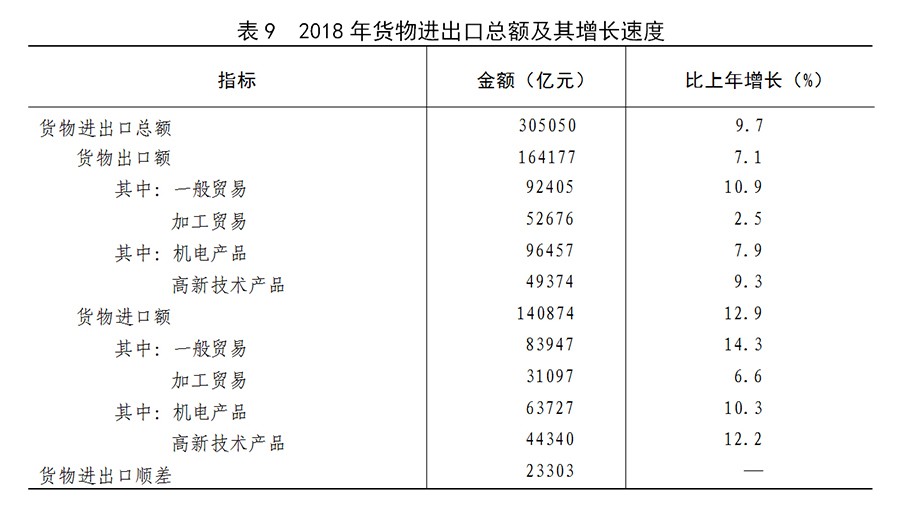
The total import and export volume of goods in the whole year was 30.505 billion yuan, an increase of 9.7% over the previous year. Among them, exports were 16,417.7 billion yuan, an increase of 7.1%; Imports reached 14,087.4 billion yuan, up by 12.9%. The import and export surplus of goods was 2,330.3 billion yuan, a decrease of 521.7 billion yuan over the previous year. The total import and export volume of countries along the "Belt and Road" [49] was 8,365.7 billion yuan, an increase of 13.3% over the previous year. Among them, exports were 4,647.8 billion yuan, up by 7.9%; Imports reached 3,717.9 billion yuan, up by 20.9%.
The total import and export of services in the whole year was 5,240.2 billion yuan, an increase of 11.5% over the previous year. Among them, service exports were 1,765.8 billion yuan, up by 14.6%; Service imports reached 3,474.4 billion yuan, up by 10.0%. The service import and export deficit was 1,708.6 billion yuan.
In 2001, foreign direct investment (excluding banking, securities and insurance) set up 60,533 new enterprises, an increase of 69.8% over the previous year. The actual amount of foreign direct investment was 885.6 billion yuan, up by 0.9%, or $135 billion, up by 3.0%. Among them, 4,479 newly established enterprises were directly invested in China by countries along the "Belt and Road", an increase of 16.1%; The amount of direct investment in China was 42.4 billion yuan, up by 13.2%, equivalent to 6.4 billion US dollars, up by 16.0%. In 2001, the actual use of foreign capital in high-tech manufacturing industry was 89.8 billion yuan, up by 35.1%, equivalent to 13.7 billion US dollars, up by 38.1%.
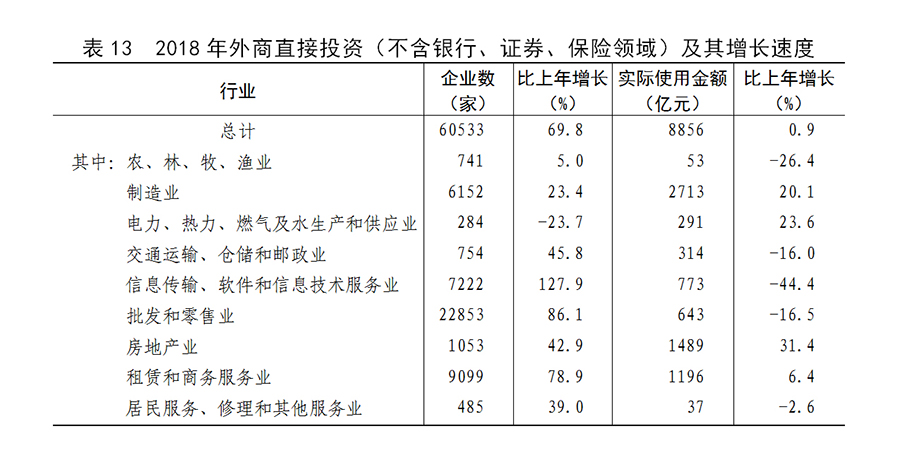
Table 13: Foreign direct investment (excluding banking, securities and insurance) and its growth rate in 2018 Xinhua News Agency issued
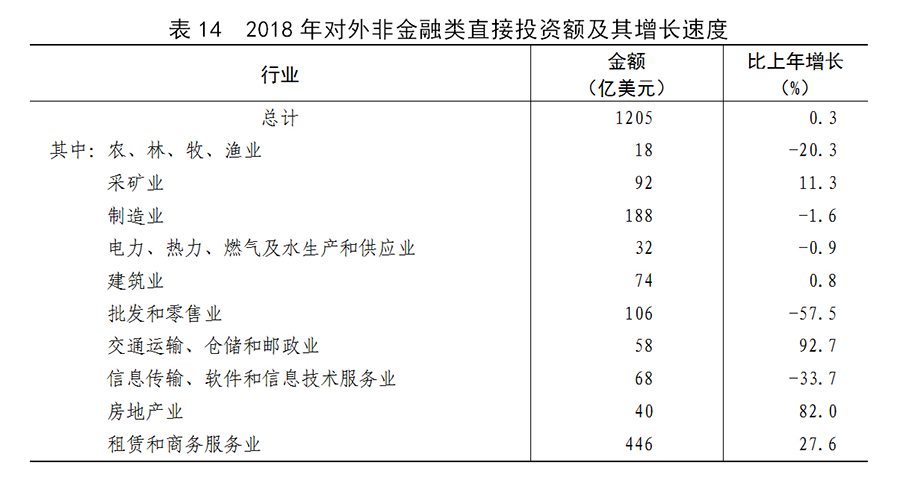
In 2001, foreign non-financial direct investment was 797.4 billion yuan, down 1.6% from the previous year, equivalent to 120.5 billion US dollars, up 0.3%. Among them, the non-financial direct investment in countries along the "Belt and Road" was 15.6 billion US dollars, an increase of 8.9%.
In 2001, the turnover of foreign contracted projects was 1,118.6 billion yuan, down 1.7% from the previous year, equivalent to 169 billion US dollars, up 0.3%. Among them, the turnover of countries along the "Belt and Road" was 89.3 billion US dollars, an increase of 4.4%, accounting for 52.8% of the turnover of foreign contracted projects. Foreign labor cooperation sent 490,000 laborers of various types.
VIII. Finance and finance
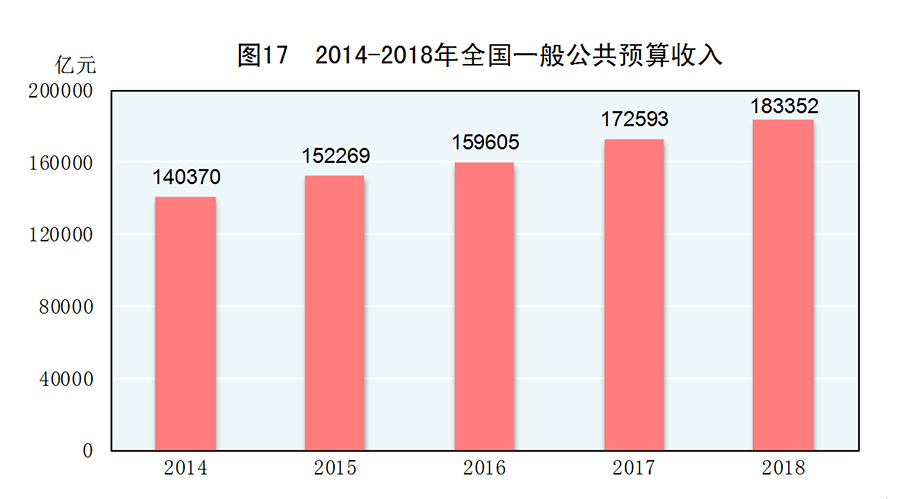
In the whole year, the national general public budget revenue was 18,335.2 billion yuan, an increase of 6.2% over the previous year. Among them, tax revenue was 15,640.1 billion yuan, an increase of 1,203.1 billion yuan or 8.3% over the previous year. A total of 1,313 billion yuan of local government replacement bonds were issued throughout the year, with an average interest rate of about 3.89%. In 2015-2018, a total of 12.2 trillion yuan of replacement bonds were issued, which basically achieved the established bond swap target of stock government. After replacement, the average interest rate of local government debt at the end of 2014 decreased by about 6.5 percentage points, and the accumulated interest savings were about 1.7 trillion yuan.
At the end of the year, the balance of broad money supply (M2) was 182.7 trillion yuan, an increase of 8.1% over the end of last year. The balance of narrow money supply (M1) was 55.2 trillion yuan, up by 1.5%; The balance of money in circulation (M0) was 7.3 trillion yuan, up by 3.6%.
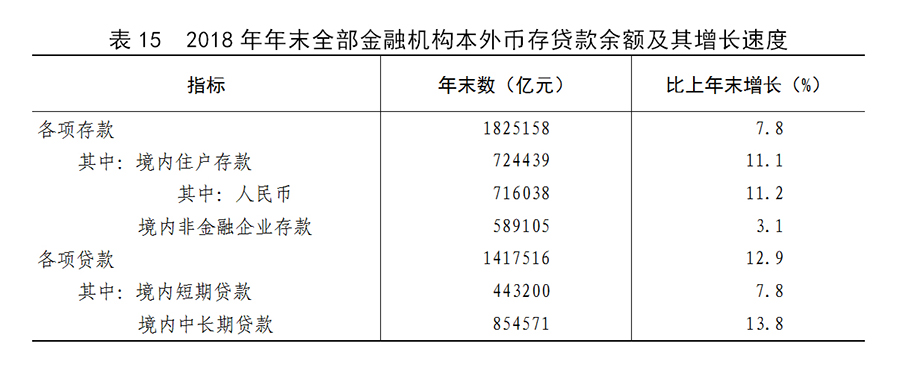
In the whole year, the scale of social financing increased by 19.3 trillion yuan, which was 3.1 trillion yuan less than that of the previous year. At the end of the year, the stock of social financing scale [52] was 200.7 trillion yuan, an increase of 9.8% over the end of the previous year. At the end of the year, the balance of local and foreign currency deposits of all financial institutions was 182.5 trillion yuan, an increase of 13.2 trillion yuan over the beginning of the year, of which the balance of RMB deposits was 177.5 trillion yuan, an increase of 13.4 trillion yuan. The balance of local and foreign currency loans of all financial institutions was 141.8 trillion yuan, up 16.2 trillion yuan, of which the balance of RMB loans was 136.3 trillion yuan, up 16.2 trillion yuan.
At the end of the year, the balance of RMB loans of major rural financial institutions (rural credit cooperatives, rural cooperative banks and rural commercial banks) was 16,982.2 billion yuan, an increase of 2,000.2 billion yuan over the beginning of the year. The balance of RMB consumer loans of all financial institutions was 37,790.3 billion yuan, an increase of 6,270.9 billion yuan. Among them, the balance of personal short-term consumer loans was 8,799.4 billion yuan, an increase of 1,998.9 billion yuan; The balance of personal medium and long-term consumer loans was 28,990.9 billion yuan, an increase of 4,272 billion yuan.
In the whole year, domestic trading places raised [5.3] 6,436.5 billion yuan, an increase of 1,357.2 billion yuan over the previous year. Among them, the initial public offering of 105 A shares raised 137.8 billion yuan, a decrease of 92.3 billion yuan; A-share cash refinancing (including public issuance, private placement, rights issue and preferred stock) was 550.5 billion yuan, a decrease of 250.4 billion yuan; Various entities raised 5,687.8 billion yuan by issuing bonds (including corporate bonds, convertible bonds, exchangeable bonds, policy financial bonds, local government bonds and enterprise asset-backed securities) on the Shanghai and Shenzhen Stock Exchanges, an increase of 1,773.1 billion yuan; The national share transfer system for small and medium-sized enterprises [54] added 577 listed companies, and the listed companies raised a total of 60.4 billion yuan.
Corporate credit bonds [55] amounted to 7.79 trillion yuan, an increase of 1.92 trillion yuan over the previous year.
In the whole year, the original insurance premium income of insurance companies was 3,801.7 billion yuan, an increase of 3.9% over the previous year. Among them, the original insurance premium income of life insurance business was 2,072.3 billion yuan, the original insurance premium income of health insurance and accidental injury insurance business was 652.4 billion yuan, and the original insurance premium income of property insurance business was 1,077 billion yuan. Pay all kinds of reparations and pay 1,229.8 billion yuan. Among them, life insurance paid 438.9 billion yuan, health insurance and accident insurance paid 201.2 billion yuan, and property insurance paid 589.7 billion yuan.
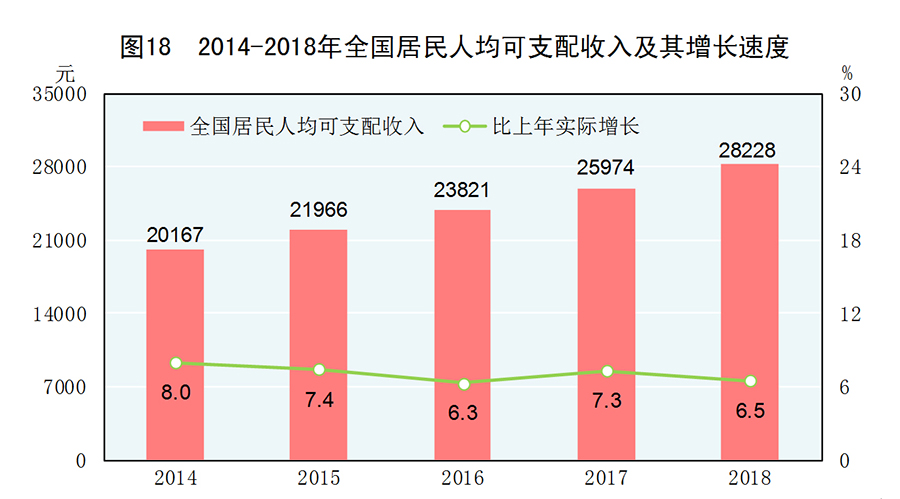
Income, consumption and social security of residents
In the whole year, the per capita disposable income of the national residents was 28,228 yuan, an increase of 8.7% over the previous year. After deducting the price factor, the real increase was 6.5%. The median per capita disposable income of the national residents [57] was 24,336 yuan, an increase of 8.6%. According to the place of permanent residence, the per capita disposable income of urban residents was 39,251 yuan, an increase of 7.8% over the previous year, and a real increase of 5.6% after deducting the price factor. The median per capita disposable income of urban residents was 36,413 yuan, an increase of 7.6%. The per capita disposable income of rural residents was 14,617 yuan, an increase of 8.8% over the previous year. After deducting the price factor, the real increase was 6.6%. The median per capita disposable income of rural residents was 13,066 yuan, an increase of 9.2%. According to the national income quintile [58], the per capita disposable income of the low-income group is 6440 yuan, the per capita disposable income of the lower middle income group is 14361 yuan, the per capita disposable income of the middle income group is 23189 yuan, the per capita disposable income of the upper middle income group is 36471 yuan, and the per capita disposable income of the high income group is 70640 yuan. The average monthly income of migrant workers nationwide was 3,721 yuan, an increase of 6.8% over the previous year.
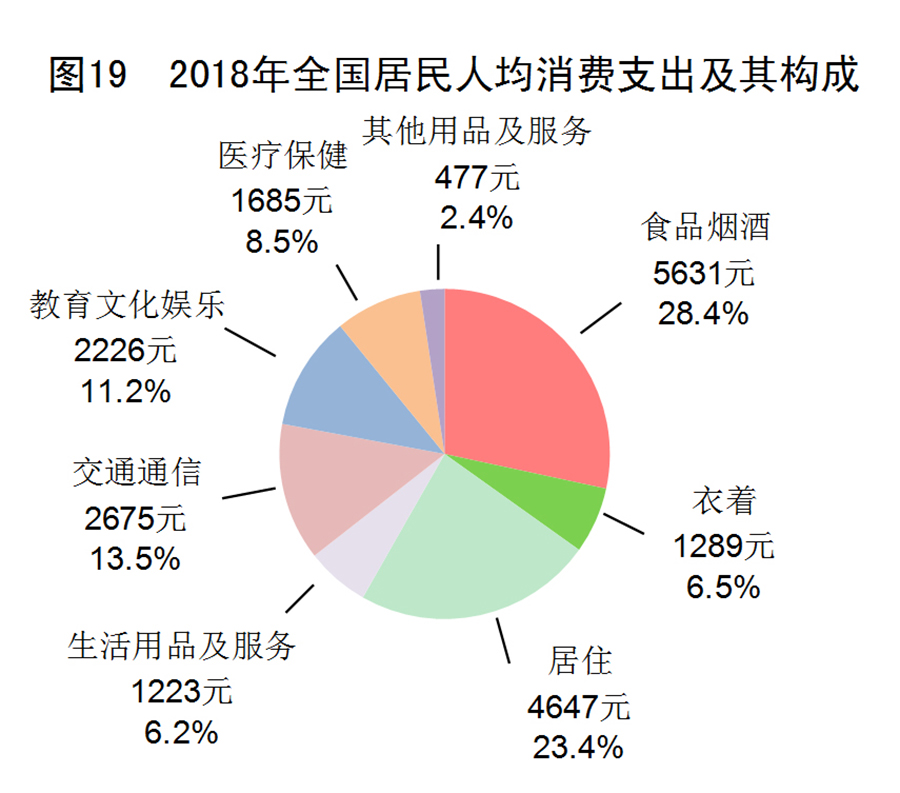
In the whole year, the per capita consumption expenditure of the national residents was 19,853 yuan, an increase of 8.4% over the previous year, and a real increase of 6.2% after deducting the price factor. According to the place of permanent residence, the per capita consumption expenditure of urban residents was 26,112 yuan, an increase of 6.8%, and the actual increase was 4.6% after deducting the price factor; The per capita consumption expenditure of rural residents was 12,124 yuan, up by 10.7%. After deducting the price factor, it actually increased by 8.4%. The Engel’s coefficient of national residents was 28.4%, down 0.9 percentage points from the previous year, including 27.7% in cities and towns and 30.1% in rural areas.
At the end of the year, the number of people participating in the basic old-age insurance for urban workers nationwide was 418.48 million, an increase of 15.55 million over the end of last year. The number of people participating in the basic old-age insurance for urban and rural residents was 523.92 million, an increase of 11.37 million. The number of people participating in basic medical insurance was 1,344.52 million, an increase of 167.71 million. Among them, the number of employees participating in basic medical insurance was 316.73 million, an increase of 13.51 million; The number of people participating in the basic medical insurance for urban and rural residents was 897.41 million, an increase of 23.82 million. The number of people participating in unemployment insurance was 196.43 million, an increase of 8.59 million. At the end of the year, the number of people receiving unemployment insurance benefits nationwide was 2.23 million. The number of people participating in industrial injury insurance was 238.68 million, an increase of 11.45 million, of which 80.85 million were migrant workers, an increase of 2.78 million. The number of people participating in maternity insurance was 204.35 million, an increase of 11.35 million. At the end of the year, a total of 10.08 million people in China enjoyed the minimum living guarantee for urban residents, 35.2 million people enjoyed the minimum living guarantee for rural residents, 4.55 million people enjoyed the assistance and support of rural poor people, and 10.75 million people received temporary assistance throughout the year. In the whole year, 49.72 million people participated in basic medical insurance and 38.25 million people received medical assistance. The state provided pensions and subsidies to 8.61 million ex-servicemen and other special care recipients.
At the end of the year, there were 33,000 social service organizations providing accommodation in China, including 30,000 for the aged and 664 for children. There are 7.824 million social service beds, including 7.463 million beds for the aged and 104,000 beds for children. By the end of the year, there were 27,000 community service centers and 145,000 community service stations.
X. Science, Technology and Education
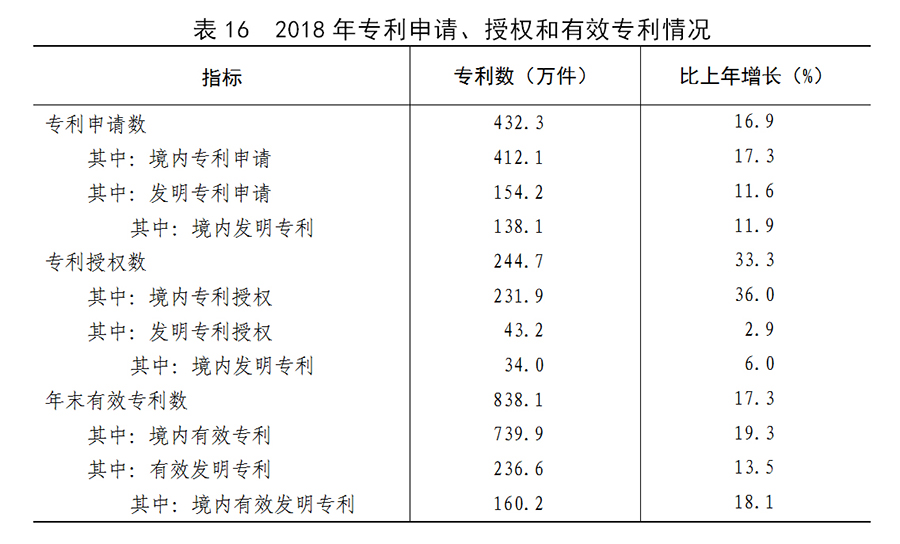
The annual expenditure on research and experimental development (R&D) was 1,965.7 billion yuan, an increase of 11.6% over the previous year, accounting for 2.18% of the GDP, including 111.8 billion yuan for basic research. In the whole year, 1,052 key national R&D programs were arranged, 563 major national science and technology projects were arranged, and 44,504 projects were funded by the National Natural Science Foundation. By the end of the year, there were 501 national key laboratories in operation, 132 national engineering research centers, 217 national engineering laboratories and 1480 national enterprise technology centers. The National Scientific and Technological Achievements Transformation Guidance Fund has set up a total of 21 Zhi Zi Funds with a total capital of 31.3 billion yuan. In 2001, there were 4.323 million domestic and foreign patent applications, an increase of 16.9% over the previous year; 2.447 million patents were granted, an increase of 33.3%; The number of PCT patent applications accepted [62] was 55,000. By the end of the year, there were 8.381 million valid patents, including 1.602 million valid invention patents in China, and the number of invention patents per 10,000 population was 11.5. In 2001, 412,000 technology contracts were signed, with a turnover of 1,769.7 billion yuan, an increase of 31.8% over the previous year.
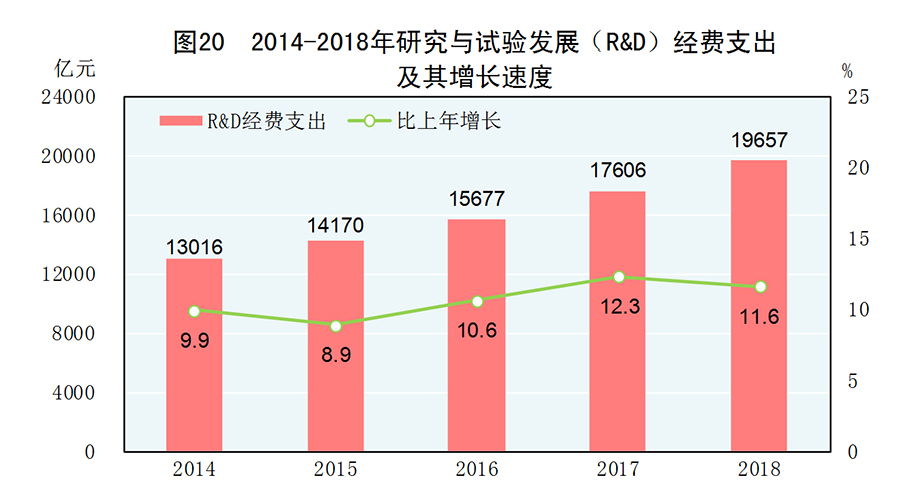
Figure 20: R&D expenditure and its growth rate from 2014 to 2018, Xinhua News Agency issued.
38 space launches were successfully completed throughout the year. The Chang ‘e-4 probe successfully landed on the back of the moon and sent the data back to Earth through relay stars, marking the official opening of the first lunar patrol mission. The basic system of Beidou-3 was completed and began to provide global services; The first space-based platform of China’s seismic stereo observation system, the Italian electromagnetic monitoring test satellite, and the first satellite of Sino-French space cooperation, the Sino-French Ocean Satellite, were successfully launched. The second aircraft carrier went to sea for trial flight, the domestic large-scale amphibious aircraft made its first flight on the water, and the Hong Kong-Zhuhai-Macao Bridge was officially opened to traffic.
At the end of the year, there were 791 national quality inspection centers in China. There are 484 certification bodies for product quality, system and service in China, and 630,000 enterprises have been certified. There are 5030 legal metrological technical institutions in China, and 104.06 million measuring instruments are subject to compulsory verification throughout the year. In the whole year, 2,668 national standards were formulated and revised, of which 1,935 were newly formulated. The annual qualified rate of manufacturing products [63] was 93.93%.
In the whole year, 858,000 graduate students were enrolled, 2.731 million were studying and 604,000 were graduating. The college enrolled 7.91 million students, 28.31 million students and 7.533 million graduates. Secondary vocational education [64] enrolled 5.57 million students, 15.552 million students and 4.873 million graduates. Ordinary high schools enrolled 7.927 million students, 23.754 million students and 7.792 million graduates. Junior high school enrolled 16.026 million students, 46.526 million students and 13.678 million graduates. Ordinary primary schools enrolled 18.673 million students, 103.393 million students and 16.165 million graduates. There are 124,000 special education students, 666,000 students and 81,000 graduates. There are 46.564 million children in preschool education. The consolidation rate of nine-year compulsory education is 94.2%, and the gross enrollment rate in senior high school is 88.8%.
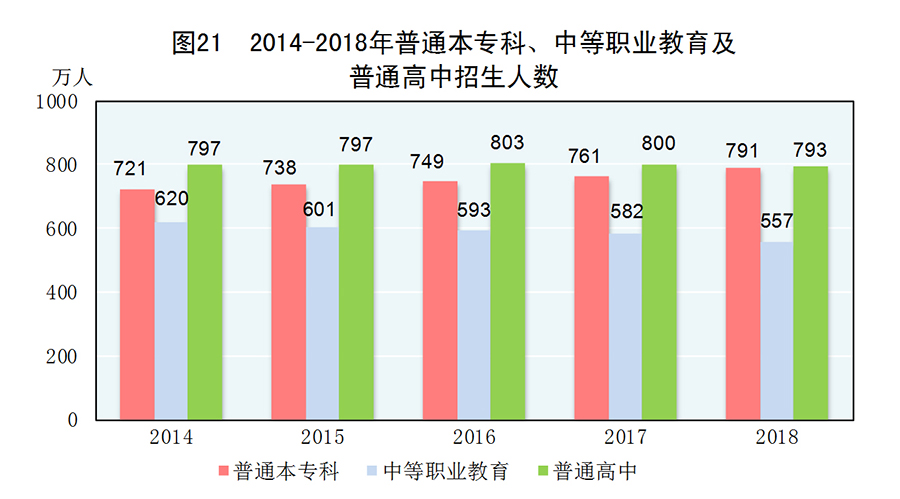
Figure 21: Number of students enrolled in junior colleges, secondary vocational education and ordinary high schools from 2014 to 2018, issued by Xinhua News Agency.
XI. Cultural Tourism, Health and Sports
At the end of the year, there were 2,075 art performance groups and 3,331 museums in the national cultural system. There are 3,173 public libraries in China, with a total circulation of [65] 845.29 million people. There are 3326 cultural centers. There are 214 million cable TV users, including 202 million cable digital TV users. At the end of the year, the comprehensive population coverage rate of radio programs was 98.9%, and that of TV programs was 99.3%. In the whole year, 323 TV series with 13,726 episodes and 86,257 minutes of TV cartoons were produced. In the whole year, 902 feature films and 180 science, education, documentary, animation and special films [66] were produced. It has published 34 billion newspapers, 2.4 billion periodicals and 9.5 billion books, with a per capita book possession of [67]6.85 books. By the end of the year, there were 4,210 archives in China, and 140.16 million volumes (pieces) of various archives had been opened.
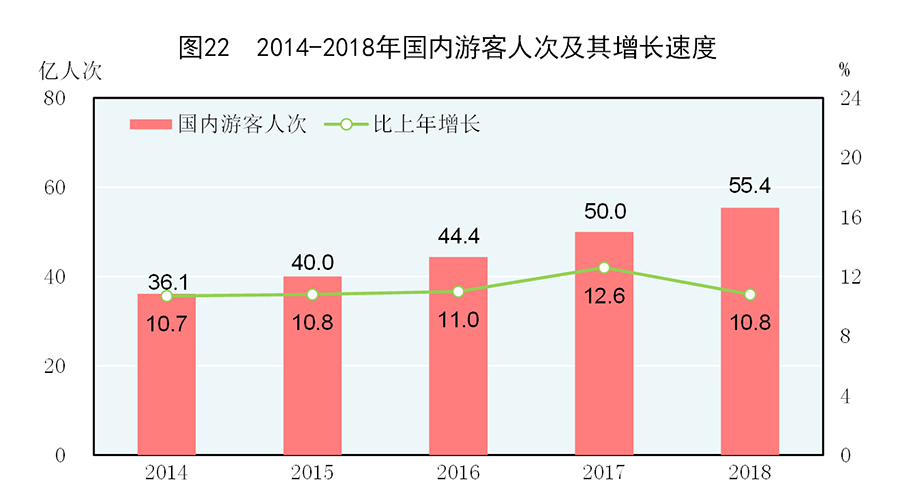
The number of domestic tourists was 5.54 billion, an increase of 10.8% over the previous year; Domestic tourism revenue was 5,127.8 billion yuan, up by 12.3%. The number of inbound tourists was 141.2 million, an increase of 1.2%. Among them, there were 30.54 million foreigners, an increase of 4.7%; There were 110.66 million compatriots from Hongkong, Macao and Taiwan Province, up by 0.3%. Among the inbound tourists, there were 62.9 million overnight visitors, an increase of 3.6%. International tourism revenue was $127.1 billion, up by 3.0%. Domestic residents left the country 161.99 million times, an increase of 13.5%. Among them, 155.02 million people went abroad for private reasons, an increase of 14.1%; 99.19 million people went abroad to Hong Kong, Macao and Taiwan, an increase of 14.0%.
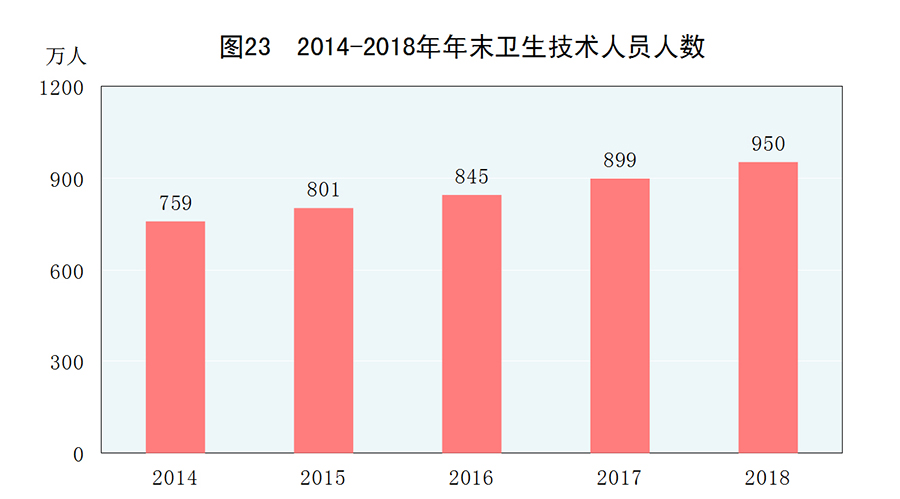
At the end of the year, there were 1.004 million medical and health institutions in China, including 32,000 hospitals, 12,000 public hospitals and 20,000 private hospitals. There are 950,000 primary medical and health institutions, including 36,000 township hospitals, 35,000 community health service centers (stations), 248,000 outpatient departments (institutes) and 630,000 village clinics; There are 19,000 professional public health institutions, including 3,469 centers for disease control and prevention and 3,141 health supervision centers. At the end of the year, there were 9.5 million health technicians, including 3.58 million licensed doctors and assistant licensed doctors and 4.12 million registered nurses. There are 8.45 million beds in medical and health institutions, including 6.56 million in hospitals and 1.34 million in township hospitals. In the whole year, the total number of medical consultations was [6.8] 8.42 billion, and the number of discharged patients was [6.9] 260 million.
In the whole year, Chinese athletes won 118 world championships in 24 sports, creating 15 world records. China’s disabled athletes won 50 world championships in 20 international competitions.
XII. Resources, Environment and Emergency Management
The total supply of state-owned construction land in China was [70] 643,000 hectares, an increase of 6.6% over the previous year. Among them, the industrial, mining and storage land is 132,000 hectares, an increase of 7.2%; Real estate land [71] 144,000 hectares, an increase of 24.6%; Infrastructure and other land use was 368,000 hectares, an increase of 0.7%.
The total amount of water resources in the whole year was 2,796 billion cubic meters. The total annual water consumption was 611 billion cubic meters, an increase of 1.1% over the previous year. Among them, domestic water consumption increased by 1.4%, industrial water consumption increased by 0.6%, agricultural water consumption increased by 1.1%, and ecological water supplement increased by 3.8%. The water consumption per 10,000 yuan of GDP is [72]73 cubic meters, down by 5.1% over the previous year. The water consumption per 10,000 yuan of industrial added value was 45 cubic meters, down 5.2%. The per capita water consumption was 439 cubic meters, an increase of 0.6% over the previous year.
The afforestation area was 7.07 million hectares, including 3.6 million hectares of artificial afforestation, accounting for 50.9% of the total afforestation area. Forest tending area is 8.52 million hectares. By the end of the year, there were 474 national nature reserves. The newly-increased soil erosion control area is 54,000 square kilometers.
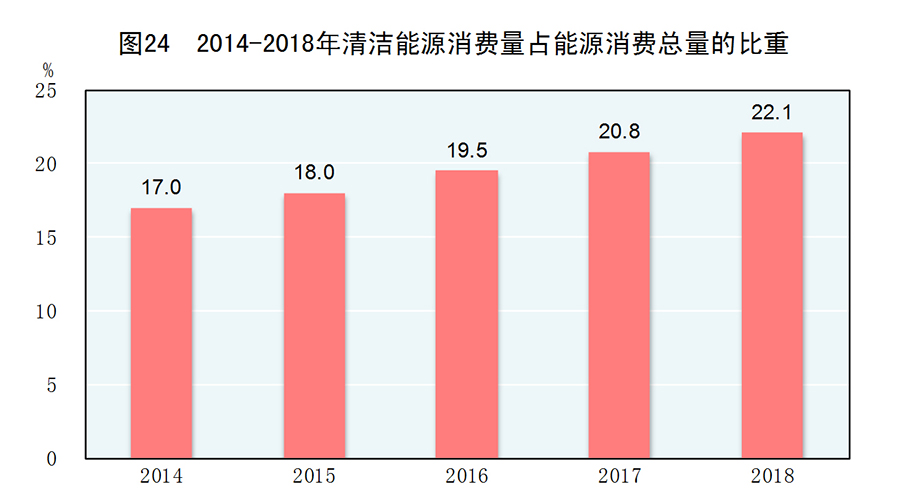
According to preliminary accounting, the total energy consumption in the whole year was 4.64 billion tons of standard coal, an increase of 3.3% over the previous year. Coal consumption increased by 1.0%, crude oil consumption increased by 6.5%, natural gas consumption increased by 17.7% and electricity consumption increased by 8.5%. Coal consumption accounted for 59.0% of the total energy consumption, down 1.4 percentage points from the previous year; The consumption of clean energy such as natural gas, hydropower, nuclear power and wind power accounted for 22.1% of the total energy consumption, up by 1.3 percentage points. The comprehensive energy consumption of caustic soda per unit, synthetic ammonia per unit, steel per ton, copper smelting per unit, and standard coal consumption per kWh of thermal power generation decreased by 0.5%, 0.7%, 3.3% and 4.7%, respectively. Carbon dioxide emissions per 10,000 yuan of GDP in China decreased by 4.0%.
Among the 417 monitoring points of seawater quality in coastal waters, 74.6% of the monitoring points meet the national Grade I and II seawater quality standards, 6.7% are Grade III seawater, and 18.7% are Grade IV and Grade IV seawater.
Among the 338 monitored cities at prefecture level and above, 35.8% of them meet the urban air quality standards, and 64.2% fail to meet the standards. The average annual concentration of fine particulate matter (PM2.5) in cities that failed to meet the standard (based on 262 cities where the average concentration of PM2.5 failed to meet the standard in 2015) was 43 μ g/m3, down 10.4% from the previous year.
Among the 323 cities that have carried out urban regional acoustic environment monitoring, 4.0% are cities with good acoustic environment quality, 63.5% are good, 30.7% are average, 1.2% are poor, and 0.6% are poor.
The annual average temperature was 10.09℃, down 0.30℃ from the previous year. A total of 10 typhoons landed.
The affected area of crops in the whole year was 20.81 million hectares, of which 2.59 million hectares were never harvested. In the whole year, the direct economic loss caused by floods and geological disasters was 106.1 billion yuan, the direct economic loss caused by drought was 25.5 billion yuan, the direct economic loss caused by low-temperature freezing and snowstorm was 43.4 billion yuan, and the direct economic loss caused by marine disasters was 4.8 billion yuan. In the whole year, there were 16 earthquakes of magnitude 5.0 or above in mainland China, which caused 11 disasters and caused direct economic losses of about 3 billion yuan. A total of 2,478 forest fires occurred in the whole year, and the affected forest area was 16,000 hectares.
A total of 34,046 people died in various production safety accidents throughout the year. There were 100,000 employees in industrial, mining and commercial enterprises, and 1.547 people died in production safety accidents, down by 5.6% over the previous year. The number of deaths per million tons in coal mines was 0.093, down by 12.3%. The number of deaths per 10,000 vehicles in road traffic accidents was 1.93, down by 6.3%.
Notes:
[1] The data in this bulletin are preliminary statistics. The statistics do not include Hong Kong Special Administrative Region, Macao Special Administrative Region and Taiwan Province Province. Due to rounding, some data are not equal to the total of sub-items.
[2] The absolute figures of GDP, added value of various industries, per capita GDP and gross national income are calculated at current prices, and the growth rate is calculated at constant prices. According to the results of the third national agricultural census, the historical data such as gross domestic product, the proportion of added value of three industries and the labor productivity of all employees were revised.
[3] Gross national income, formerly known as gross national product, refers to the total initial distribution income obtained by all permanent units in a country or region within a certain period of time, which is equal to the gross domestic product plus the net initial distribution income from abroad.
[4] The energy consumption per 10,000 yuan of GDP is calculated at 2015 prices.
[5] The total labor productivity is the ratio of gross domestic product (calculated at 2015 prices) to all employed people.
[6] The population with separated households refers to the population whose residence is inconsistent with the township street where the household registration is located and who has left the household registration for half a year or more.
[7] Floating population refers to the population separated by households, excluding the population separated by households within the municipal area. The population with separated households within the municipal area refers to the population within the jurisdiction of a municipality directly under the central government or prefecture-level city and between districts, whose residence and household registration are not in the same township street.
[8] At the end of 2018, the population aged 0-14 (including those under 15 years old) was 235.23 million, and the population aged 15-59 (including those under 60 years old) was 910.66 million.
[9] The annual number of migrant workers includes two parts: migrant workers who have been employed outside their own towns for 6 months or more and local migrant workers who have been engaged in non-agricultural industries for 6 months or more in their own towns.
[10] The producer price of agricultural products refers to the price when agricultural producers directly sell their products.
[11] Housing prices include rental housing rent, housing maintenance and management, water, electricity and fuel prices.
[12] Capacity utilization refers to the ratio of actual output to production capacity (both measured in value). The actual output of an enterprise refers to the total industrial output value of the enterprise during the reporting period; The production capacity of an enterprise refers to the product output that the enterprise can realize and maintain for a long time when the production equipment (machinery) keeps normal operation under the condition of guaranteed supply of labor, raw materials, fuel and transportation during the reporting period.
[13] Due to the adjustment of the caliber stipulated in the statistical system, statistical law enforcement, elimination of duplicate data, and divestiture of enterprise reform, the growth rate and changes of financial indicators of industrial enterprises above designated size in 2018 are calculated according to comparable caliber.
[14] Industrial strategic emerging industries include energy-saving and environmental protection industries, next-generation information technology industries, biological industries, high-end equipment manufacturing industries, new energy industries, new materials industries, new energy automobile industries and other seven industries.
[15] High-tech manufacturing includes pharmaceutical manufacturing, aviation, spacecraft and equipment manufacturing, electronic and communication equipment manufacturing, computer and office equipment manufacturing, medical equipment and instrumentation manufacturing, and information chemicals manufacturing.
[16] Equipment manufacturing industry includes metal products industry, general equipment manufacturing industry, special equipment manufacturing industry, automobile manufacturing industry, railway, ship, aerospace and other transportation equipment manufacturing industry, electrical machinery and equipment manufacturing industry, computer, communication and other electronic equipment manufacturing industry, and instrument manufacturing industry.
[17] The statistical scope of service industries above designated size includes transportation, warehousing and postal services, information transmission, software and information technology services, real estate (excluding real estate development and operation), leasing and business services, scientific research and technical services, water conservancy, environment and public facilities management, education, health and social work, with annual business income of 10 million yuan or more; Residents’ service, repair and other service industries, cultural, sports and entertainment legal entities with annual business income of 5 million yuan or more, or employees of 50 or more at the end of the year.
[18] Strategic emerging service industries include service-related industries in seven major industries, including energy conservation and environmental protection industry, new generation information technology industry, biological industry, high-end equipment manufacturing industry, new energy industry, new materials industry and new energy automobile industry.
[19] High-tech industry investment includes six categories of high-tech manufacturing investment such as pharmaceutical manufacturing, aerospace and equipment manufacturing, and nine categories of high-tech service investment such as information services and e-commerce services.
[20] Investment in industrial technological transformation refers to the investment activities that industrial enterprises use new technologies, new processes, new equipment and new materials to transform and upgrade existing facilities, technological conditions and production services to achieve connotative development.
[21] Online retail sales refer to the retail sales of goods and services realized through public online trading platforms (online platforms mainly engaged in physical commodity trading, including self-built websites and third-party platforms). The growth rate of online retail sales in 2018 is calculated by comparable caliber.
[22] Poverty reduction is equal to the poverty-stricken population in that year MINUS the poverty-stricken population in the previous year, and it is also equivalent to the poverty-stricken population in that year MINUS the population returning to poverty in that year.
[23] The incidence of poverty refers to the proportion of poor people in the target survey population.
[24] Poverty-stricken areas include concentrated contiguous poverty-stricken areas and national key counties for poverty alleviation and development outside the area, with a total of 832 counties. In 2017, the Aksu region of Xinjiang began to be included in poverty monitoring.
[25] Historical data of agriculture, animal husbandry and fishery were revised according to the results of the third national agricultural census.
[26] The output data of some products in 2017 were verified and adjusted, and the output growth rate in 2018 was calculated according to the adjusted comparable caliber.
[27] Thermal power includes coal-fired power generation, oil-fired power generation, gas-fired power generation, waste heat, residual pressure and residual gas power generation, garbage incineration power generation and biomass power generation.
[28] The steel output data includes about 218 million tons of steel repeatedly processed between enterprises.
[29] In 2018, China Electric Power Enterprise Federation adjusted the statistical scope of installed power generation capacity, and the growth rate was calculated according to comparable caliber.
[30] A small amount of installed power generation capacity (such as geothermal) is not listed in the bulletin.
[31] See note [13].
[32] In 2018, the statistical scope of cargo throughput of some ports above designated size was adjusted and extended to all enterprises in Hong Kong, and the growth rate of relevant indicators was calculated according to comparable caliber.
[33] The total passenger transportation includes railway, highway, water transport and civil aviation business passenger transportation, of which highway passenger transportation accounts for more than 70%. In recent years, with the change of people’s travel mode, the number of residents traveling by car, online car sharing and carpooling has increased rapidly, which has diverted the road passenger traffic and led to a decline in the total passenger transportation.
[34] The total business volume of postal industry is calculated at the price of 2010.
[35] The total telecom business is calculated at 2015 prices.
The capacity of mobile telephone exchange refers to the maximum number of simultaneous service users calculated by mobile telephone exchange according to a certain traffic model and the processing capacity of the exchange.
[37] Fixed Internet broadband access users refer to users who registered in telecom enterprises at the end of the reporting period and accessed the public Internet through xDSL, FTTx+LAN, FTTH/O and other broadband access methods and ordinary private lines.
[38] Fixed Internet fiber-optic broadband access users refer to users who registered in telecom enterprises at the end of the reporting period and accessed the public Internet through FTTH or FTTO.
[39] Mobile broadband users refer to online users who have usage information in the billing system at the end of the reporting period and occupy 3G or 4G network resources.
[40] Software and information technology services include software development, integrated circuit design, information system integration and Internet of Things technical services, operation and maintenance services, information processing and storage support services, information technology consulting services, digital content services and other information technology services.
[41] According to the results of the third national agricultural census and relevant regulations, the total retail sales of social consumer goods in 2017 and the sub-base are revised, and the growth rate in 2018 is calculated according to comparable caliber.
[42] According to the statistical law enforcement inspection and the results of the fourth national economic census, the fixed assets investment base in 2017 was revised, and the growth rate in 2018 was calculated according to the comparable caliber.
[43] The eastern region refers to the ten provinces (cities) of Beijing, Tianjin, Hebei, Shanghai, Jiangsu, Zhejiang, Fujian, Shandong, Guangdong and Hainan; The central region refers to the six provinces of Shanxi, Anhui, Jiangxi, Henan, Hubei and Hunan; The western region refers to 12 provinces (autonomous regions and municipalities) of Inner Mongolia, Guangxi, Chongqing, Sichuan, Guizhou, Yunnan, Tibet, Shaanxi, Gansu, Qinghai, Ningxia and Xinjiang; Northeast China refers to Liaoning, Jilin and Heilongjiang provinces.
[44] Private investment in fixed assets refers to the investment in the construction or purchase of fixed assets by domestic enterprises and institutions with collective, private and individual nature and enterprises controlled by them (including absolute holding and relative holding).
[45] Infrastructure investment includes transportation, postal services, telecommunications, radio and television and satellite transmission services, Internet and related services, and investment in water conservancy, environment and public facilities management.
[46] In addition to real estate development investment, real estate investment also includes self-built houses by construction units, property management, intermediary services and other real estate investments.
[47] High-speed railway refers to the railway with a maximum line speed of 200 km/h and above and the railway running only EMU trains below 200 km/h..
[48] The provinces (autonomous regions and municipalities directly under the Central Government) reported the actual completion of the renovation of dilapidated houses in rural areas of poverty-stricken households by the end of December 2018.
[49] The Belt and Road Initiative refers to the Silk Road Economic Belt and the 21st Century Maritime Silk Road.
[50] The import and export of services are counted according to the standard of Balance of Payments Manual (Sixth Edition), and the growth rate is calculated according to comparable caliber.
[51] The increment of social financing scale refers to the total amount of funds obtained by the real economy from the financial system in a certain period of time.
[52] The stock of social financing scale refers to the balance of funds obtained by the real economy from the financial system at the end of a certain period (the end of the month, the end of the season or the end of the year).
[53] The amount of funds raised in the domestic stock market is counted according to the listing date.
[54] The national share transfer system for small and medium-sized enterprises, also known as the "New Third Board", is a national stock exchange approved by the State Council in 2012. The accumulated fund-raising of listed companies in the national share transfer system for small and medium-sized enterprises in the whole year does not include preferred shares.
[55] Corporate credit bonds include non-financial corporate debt financing instruments, corporate bonds, corporate bonds and convertible bonds.
[56] The original insurance premium income refers to the original insurance contract premium income confirmed by the insurance enterprise.
[57] The median per capita income refers to the per capita income of all the survey households in the middle position according to the per capita income level from low to high (or from high to low).
[58] The quintuple income grouping of national residents refers to arranging all the surveyed households from high to low according to the per capita income level, and dividing them into five equal parts on average. The income group in the top 20% is the high income group, and so on, followed by the upper middle income group, the middle income group, the lower middle income group and the low income group.
[59] Poor people in rural areas refer to the rural elderly, disabled people and minors under the age of 16 who have no ability to work, no source of income, no obligation to support, support or their legal obligations.
[60] Temporary assistance is an emergency and transitional assistance given by the state to families or individuals whose basic life is in trouble due to unexpected events, accidental injuries, serious diseases or other special reasons, which can not be covered by other social assistance systems for the time being or whose basic life is still in serious difficulties for the time being after assistance.
[61] In addition to adoption institutions, the number of social service beds also includes beds in rescue institutions, community institutions, military rest homes, military supply stations and other institutions.
[62]PCT patent application acceptance refers to the number of PCT patent applications accepted by China National Intellectual Property Administration as the PCT patent application acceptance bureau. PCT(Patent Cooperation Treaty) is an international cooperation treaty in the patent field.
[63] The qualification rate of product quality in manufacturing industry refers to the implementation of quality sampling inspection by means of product quality inspection in accordance with the prescribed methods, procedures and standards, and the number of samples judged as qualified accounts for the percentage of all sampled samples. The statistical survey samples cover 29 industries in manufacturing industry.
[64] Secondary vocational education includes general secondary schools, adult secondary schools, vocational high schools and technical schools.
[65] The total number of people in circulation refers to the total number of people who received library services in the library venues this year, including borrowing books and periodicals, consulting questions and participating in various reader activities.
[66] Special films refer to those films that are displayed in different ways from conventional cinemas in terms of technology, equipment and programs, such as image maximum, stereoscopic movies, stereoscopic special effects (4D) movies, dynamic movies and dome movies.
[67] The per capita book ownership refers to the number of books published in the same year that each person in the country can own within one year.
[68] The total number of medical visits refers to the total number of medical visits, including outpatient visits, emergency visits, home visits, appointments, individual health examinations, and health consultation and guidance (excluding health lectures).
[69] The number of discharged patients refers to the number of all discharged patients after hospitalization during the reporting period, including those who were discharged from hospital by doctor’s advice, transferred to other medical institutions by doctor’s advice, those who were not discharged by doctor’s advice, those who died and others, excluding the number of family sickbeds.
[70] The total supply of state-owned construction land refers to the total supply of state-owned construction land provided by the municipal and county people’s governments to units or individuals for use according to the annual land supply plan in accordance with the law.
[71] Real estate land refers to the sum of commercial service land and residential land.
[72] The water consumption of 10,000 yuan of GDP and 10,000 yuan of industrial added value is calculated at 2015 prices.
Source:
The data of urbanization rate of registered population, civil cars and road traffic accidents in this bulletin come from the Ministry of Public Security; The data of new employment, registered unemployment rate, social security and technical schools in cities and towns come from Ministry of Human Resources and Social Security; Foreign exchange reserves and exchange rate data come from the State Administration of Foreign Exchange; The output data of aquatic products come from the Ministry of Agriculture and Rural Affairs; The data of timber output, afforestation area, forest tending area and national nature reserve come from the National Forestry and Grassland Bureau. The data of irrigation area, water resources and soil erosion control area come from the Ministry of Water Resources. The data of installed power generation capacity and newly added substation equipment of 220kV and above come from China Electric Power Enterprise Association. The data of port cargo throughput, port container throughput, road transportation, water transportation, newly rebuilt road mileage, and new capacity of port 10,000-ton wharf berths come from the Ministry of Transport; The data of railway transportation, mileage of newly-built railway, mileage of newly-built double-track railway and mileage of electrified railway are from China Railway Corporation. Data of civil aviation and new civil transport airports come from the Civil Aviation Administration of China; Pipeline data comes from China Petroleum and Natural Gas Group Co., Ltd., China Petrochemical Corporation and China Offshore Oil Group Co., Ltd.; Postal service data comes from the State Post Bureau; The data of communication industry, software business income, new optical cable line length and so on come from the Ministry of Industry and Information Technology; The data of shantytown renovation and dilapidated building renovation of poor households in rural areas are from the Ministry of Housing and Urban-Rural Development; Import and export data of goods come from the General Administration of Customs;Data on service import and export, foreign direct investment, foreign direct investment, foreign contracted projects, and foreign labor cooperation come from the Ministry of Commerce. Financial data comes from the Ministry of Finance; Data of monetary, financial and corporate credit bonds come from the People’s Bank of China; The fund-raising data of domestic trading places come from China Securities Regulatory Commission; The insurance data comes from the Insurance Regulatory Commission of the Bank of China; The data of medical insurance, participation in basic medical insurance and medical assistance come from the National Medical Insurance Bureau. The data of urban and rural subsistence allowances, assistance and support for rural poor people, temporary assistance and social services come from the Ministry of Civil Affairs; The data of special care recipients comes from the Department of Veterans Affairs; National key R&D plans, national major science and technology projects, national key laboratories, scientific and technological achievements transformation guidance funds, technology contracts and other data come from the Ministry of Science and Technology; The project data of National Natural Science Foundation comes from the National Natural Science Foundation Committee; Data from National Engineering Research Center, National Engineering Laboratory and National Enterprise Technology Center come from National Development and Reform Commission. Patent data comes from China National Intellectual Property Administration; Space launch data comes from the National Bureau of Science, Technology and Industry for National Defense; Data on quality inspection, formulation and revision of national standards and qualified rate of manufacturing products come from the State Administration of Market Supervision. Education data comes from the Ministry of Education; Art performance groups, museums, public libraries, cultural centers, books and tourism data come from the Ministry of Culture and Tourism; Television and radio data come from the State Administration of Radio and Television; The film data comes from the National Film Bureau; The data of newspapers and periodicals come from the State Press and Publication Administration; File data comes from the National Archives Bureau;The exit data of residents come from the National Immigration Bureau; Medical and health data come from the National Health and Wellness Committee; Sports data comes from the State Sports General Administration; The data of disabled athletes come from China Disabled Persons’ Federation; The data of state-owned construction land supply and direct economic losses caused by marine disasters come from the Ministry of Natural Resources. Data such as carbon dioxide emissions and environmental monitoring of 10,000 yuan GDP come from the Ministry of Ecology and Environment; The average temperature and landing typhoon data are from China Meteorological Bureau. The data of affected area of crops, direct economic losses caused by floods and geological disasters, direct economic losses caused by droughts, direct economic losses caused by low-temperature freezing and snowstorms, forest fires, affected forest areas and safe production come from the Emergency Management Department; The data of earthquake frequency and direct economic loss caused by earthquake disasters come from China Seismological Bureau. Other data are from the National Bureau of Statistics.
(Note: [1], [2], [3]… … [72] is the upper right corner)